XC7Z030-1FBG676C Troubleshooting Guide: Common Problems and Solutions
Having issues with the XC7Z030-1FBG676C on your board? As a complex System-on-Chip (SoC), the Xilinx Zynq-7000 series integrates a powerful processing system with programmable logic, but this complexity can introduce unique debugging challenges. This guide is written from the perspective of a senior hardware engineer to help you diagnose and solve the most common problems encountered during board bring-up and development, from power-on failures to high-speed interface instability. We will cover proven, step-by-step fixes based on official datasheet recommendations and extensive field experience.

Table of Contents
XC7Z030-1FBG676C Quick Reference
Before diving into troubleshooting, it's essential to confirm the core specifications of the device you are working with. The XC7Z030-1FBG676C is a specific part within the broader Zynq-7000 family, with its own set of capabilities and operating conditions.
| Parameter | Value |
|---|---|
| Series | Zynq-7000 |
| Processing System (PS) | Dual-core ARM Cortex-A9 MPCore |
| Programmable Logic (PL) | Artix-7 based, 125K Logic Cells |
| Package | FBG676 (676-ball Fine-Pitch BGA) |
| Speed Grade | -1 (Fastest for Commercial grade) |
| Temperature Grade | Commercial (0°C to 85°C junction temperature) |
The XC7Z030-1FBG676C is an SoC that merges the software programmability of a dual-core ARM Cortex-A9 processor with the hardware programmability of an FPGA. This architecture makes it highly suitable for a wide range of applications, including but not limited to industrial motor control, machine vision, medical imaging, advanced driver-assistance systems (ADAS), and high-performance networking equipment. The tight integration between the Processing System (PS) and Programmable Logic (PL) allows for hardware acceleration of computationally intensive tasks while the ARM cores handle control, communication, and operating system duties.
Problem #1: Boot Failure and JTAG Detection Issues
Symptom: The board appears lifeless upon power-on. There is no activity on UART, the device does not boot from the selected media (QSPI, SD Card), and the Xilinx System Controller (XSCT) or Vivado Hardware Manager cannot detect the Zynq device in the JTAG chain. The PL `DONE` light, if present, does not illuminate.
Root Cause: These symptoms almost always point to a fundamental hardware issue related to power, clocking, or reset sequencing. The Zynq-7000 has a specific power-on sequence that must be followed. Additionally, the boot mode is determined by the state of several MIO pins sampled at the de-assertion of the power-on reset (POR) signal.
Fix: A systematic approach is required. Do not immediately suspect a faulty chip; the cause is far more likely to be in the surrounding circuitry.
- Power Rail Verification: The Zynq-7000 family has multiple power domains that must be powered in a specific sequence. Refer to the Zynq-7000 AP SoC Technical Reference Manual (UG585) for the exact power-on and power-off sequencing requirements. Key rails include VCCINT (core voltage), VCCPINT (PS internal voltage), VCCPAUX (PS auxiliary voltage), and VCCO_DDR/VCC_PS_DDR (DDR interface voltage). Use a multi-channel oscilloscope to probe these rails during power-on. Trigger on the first rail that comes up and verify that subsequent rails rise in the correct order and within the specified ramp times. Pay close attention to the voltage levels; they must be within the tolerances specified in the datasheet (DS190).
- Reset Signal Analysis: The main reset signal, `PS_POR_B`, must be held low until all required power rails are stable. Once stable, this signal should be de-asserted (pulled high). Check this signal with an oscilloscope. If it rises too early or is noisy, the PS will not initialize correctly. Verify the design of your reset supervisor circuit.
- Boot Mode Pin Inspection: The Zynq device determines its primary boot source by sampling the logic levels on MIO pins MIO[8:2] when `PS_POR_B` is released. For example, to boot from JTAG (the most common mode for initial board bring-up), these pins must be set to a specific configuration. Check your schematic to ensure the pull-up and pull-down resistors on these MIO pins are correct for your intended boot mode. Use a multimeter or oscilloscope to physically measure the voltage on these pins just before and during the rising edge of the reset signal. An incorrect pull resistor value or a short can easily lead to the device attempting to boot from an unintended source.
- Clock Input Verification: The Processing System requires a stable input clock on the `PS_CLK` pin. Verify that your oscillator is providing a clock signal with the correct frequency, voltage levels, and low jitter. Use an oscilloscope to inspect the clock signal directly at the pin of the Zynq device. A missing, unstable, or out-of-spec clock will prevent the PS from starting.
Problem #2: DDR3 Memory Interface Instability
Symptom: The system boots partially but hangs when loading a large application like a Linux kernel. You experience random data corruption, kernel panics, or segmentation faults. Memory tests run from U-Boot or a bare-metal application fail, especially at higher temperatures or after the system has been running for some time.
Root Cause: The high-speed DDR3 interface is extremely sensitive to signal integrity issues. The root cause is almost always related to the physical PCB layout. Timing violations, impedance mismatches, power supply noise, and incorrect termination can all lead to a marginal or non-functional memory interface.
Fix: Debugging a DDR interface is challenging and often requires a combination of design review, software testing, and hardware measurement.
-
PCB Layout Review: This is the most critical step. Even if the board is already fabricated, reviewing the layout against Xilinx's guidelines can reveal the source of the problem. Refer to the Zynq-7000 PCB Design and Pin-Planning Guide (UG933). Key items to check are:
- Length Matching: All signals within a byte group (DQ, DQS, DM) must be tightly length-matched. The clock, address, and command signals also have their own length-matching rules relative to the data groups. Deviations of even a few millimeters can cause timing skew and bit errors.
- Impedance Control: Verify that the trace widths and stack-up were designed to achieve the specified single-ended (e.g., 50 Ohm) and differential (e.g., 100 Ohm) impedance. Use a TDR (Time-Domain Reflectometer) if available to measure the actual impedance on the board.
- Power Delivery Network (PDN): The DDR memory and the Zynq's DDR interface require clean power. Check for adequate decoupling capacitance near both the Zynq and the DDR memory chips. The VTT termination voltage rail is particularly important and must be able to source and sink current effectively.
- Vivado Zynq PS Configuration: Open your Vivado project and double-check the settings in the Zynq Processing System 7 IP core. Under the "DDR Configuration" tab, ensure that all parameters—memory type, speed bin, CAS latency, bus width—exactly match the specifications of the DDR3 chip(s) used on your PCB. Using the settings for a different memory part is a common mistake.
- Software-Based Memory Testing: Use the memory test features available in the First Stage Bootloader (FSBL) or U-Boot. These tests can often be configured to run in loops, allowing you to test for intermittent failures. If the test fails, it may provide an address range where the failures are occurring, which can sometimes hint at a specific faulty data line.
- Hardware Signal Integrity Measurement: For persistent issues, direct measurement is necessary. This requires a high-bandwidth oscilloscope and appropriate probes. Solder a probe tip or a coaxial cable to a data (DQ) or strobe (DQS) line. Run a memory test that continuously writes and reads data, and capture an eye diagram. A healthy signal will have a wide, open "eye." A closed or distorted eye indicates signal integrity problems like reflections, crosstalk, or excessive jitter.
Problem #3: AXI Interconnect Deadlocks and Performance Bottlenecks
Symptom: Your design, which combines custom IP in the Programmable Logic (PL) with the Processing System (PS), experiences hangs or deadlocks. Alternatively, data transfers between the PS and PL are much slower than theoretically calculated, creating a performance bottleneck.
Root Cause: These issues typically stem from the AXI interconnect fabric that bridges the PS and PL. Common causes include incorrect clock domain crossing (CDC), AXI protocol violations in custom IP, or resource contention within the AXI Interconnect or memory controller.
Fix: Debugging AXI issues requires a deep dive into the Vivado design and on-chip logic analysis.
- Clock Domain Crossing (CDC) Review: If your custom PL logic runs on a clock that is different from the AXI interface clock provided by the PS, you have a CDC. This is a major source of instability if not handled correctly. Do not implement your own CDC logic unless you are an expert. Instead, use Xilinx's AXI Clock Converter or AXI FIFO IPs. These IPs are specifically designed to safely transfer data between different clock domains. Review your block design in Vivado IPI to ensure these are used wherever a clock change occurs.
- AXI Protocol Validation: The AXI protocol has a set of rules governing the handshake between master and slave devices (e.g., `VALID` must not be de-asserted until a `READY` handshake occurs). A custom IP block that violates these rules can cause the entire bus to lock up. Use the "AXI VIP (Verification IP)" in a simulation environment to formally verify your custom IP's AXI interface.
- On-Chip Debugging with ILA: The most powerful tool for debugging live AXI issues is the Vivado Logic Analyzer, instantiated as an ILA (Integrated Logic Analyzer) core in your design. Connect the ILA probes to the AXI signals (AWVALID, AWREADY, WVALID, WREADY, BVALID, BREADY for writes; ARVALID, ARREADY, RVALID, RREADY for reads) between your master and slave. When a deadlock occurs, you can trigger the ILA and inspect the captured waveforms. For example, if you see a master asserting `AWVALID` (address valid) but the slave never asserts `AWREADY` (address ready), you know the slave is holding up the transaction. This immediately tells you where to focus your debugging efforts.
- Interconnect Configuration: The AXI Interconnect IP itself has many configuration options. For high-performance applications, ensure you have allocated enough data width and that the arbitration scheme is appropriate for your traffic patterns. For example, if multiple masters are trying to access a single DDR memory slave, the interconnect's arbitration and buffering can become a bottleneck. You may need to increase the number of slave interfaces on the memory controller or adjust the interconnect's internal FIFOs.
Hardware Debug Checklist
When a board with an XC7Z030-1FBG676C fails to come up, follow this systematic checklist before assuming the device is damaged. This process helps isolate the problem from the most fundamental (power) to the more complex (configuration).
| Step | Check Item | Expected Result | If Failed |
|---|---|---|---|
| 1 | Power Rail Voltages | All VCC rails (VCCINT, VCCBRAM, VCCPAUX, etc.) are within datasheet tolerance. | Check VRM circuit, load conditions, and for shorts on the PCB. |
| 2 | Power-On Sequencing | Rails rise in the order specified in UG585. | Adjust power supply sequencing logic or VRM enable signals. |
| 3 | PS_POR_B Reset Signal | Remains low until power is stable, then transitions cleanly high. | Check reset supervisor IC, RC timing circuit, and for noise sources. |
| 4 | PS_CLK Input Clock | A stable clock signal with correct frequency and amplitude is present at the IC pin. | Check oscillator, crystal, and associated passive components. Check for soldering issues. |
| 5 | Boot Mode MIO Pins | Voltage levels on MIO[8:2] at reset correspond to the intended boot mode. | Verify pull-up/pull-down resistor values and check for shorts or opens. |
| 6 | JTAG Chain Integrity | Vivado Hardware Manager or XSCT detects the ARM DAP and PL TAP controllers. | Check JTAG header connections, signal integrity, and termination resistors. |
| 7 | PL DONE Signal | After a valid bitstream is loaded via JTAG, the `DONE` pin goes high. | Bitstream may be corrupt, for the wrong device, or PL power rails (e.g., VCCINT, VCCBRAM) are faulty. |
| 8 | DDR Interface Voltages | VTT and VREF rails for the DDR memory are stable and at the correct levels (e.g., VTT = 0.5 * VDDQ). | Check the termination regulator IC and its configuration. |
Debugging a complex SoC like the Zynq-7000 is a process of elimination. By verifying each subsystem in a logical order, you can methodically narrow down the possibilities and pinpoint the root cause. If you've gone through this list and are still facing issues, it might be time to review the design against Xilinx application notes or seek a second opinion. Sometimes, a subtle layout or schematic error that was missed in the initial design review is the culprit. For comparison against known-good designs, you can explore reference boards and other products in the Zynq family. Browse Zynq-7000 Series to see other components and their associated documentation. A thorough understanding of the entire ecosystem can often provide clues to solving a specific problem.
Sourcing Genuine XC7Z030-1FBG676C Components
In today's challenging supply chain environment, the risk of encountering counterfeit or substandard components is higher than ever. For a high-complexity, high-value part like the XC7Z030-1FBG676C, the consequences of using a non-genuine part can be severe, ranging from immediate board failure to latent, hard-to-diagnose reliability issues in the field.
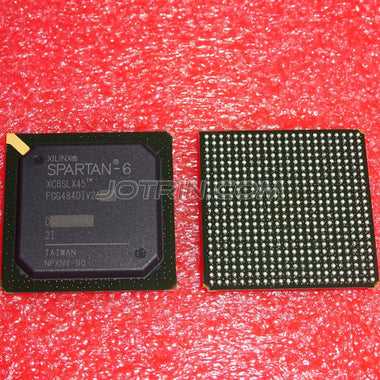
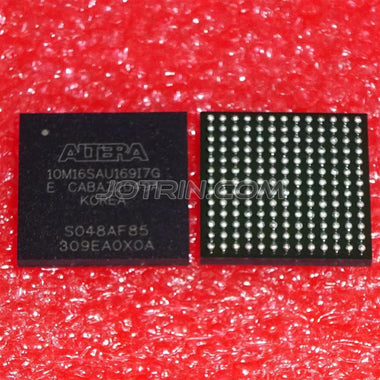
Counterfeit parts can exhibit a range of problems. They may be completely non-functional, lower speed grade parts remarked as higher-grade ones, or devices that have been salvaged from e-waste and re-balled, which can have severe internal damage or a drastically reduced lifespan. Common physical signs of a counterfeit component include inconsistent or blurry top-side markings, incorrect font or logo, a package surface that has been sanded or painted (blacktopping), and poor quality or uneven BGA spheres.
The most effective way to mitigate this risk is to source components through a trusted and traceable supply chain. While sourcing directly from the original component manufacturer (OCM) or their authorized distributors is one path, it's not always feasible for all procurement needs. This is where a reputable independent distributor plays a critical role. A trustworthy independent distributor provides access to a global inventory while maintaining rigorous quality control and anti-counterfeit inspection processes. This includes incoming visual inspection, datasheet verification, and when necessary, more advanced techniques like X-ray analysis and decapsulation to verify the die.
By partnering with a supplier that has a robust quality management system, you can procure the components you need with a high degree of confidence in their authenticity and performance. This protects your project timeline, budget, and your company's reputation. Check XC7Z030-1FBG676C Inventory & Pricing to source authentic components from a reliable partner.
Video Demonstration
Frequently Asked Questions (XC7Z030-1FBG676C FAQ)
Why is my XC7Z030-1FBG676C not detected over JTAG?
If your device isn't showing up in the JTAG chain, it's typically due to one of three fundamental issues. First, check all power rails and the power-on reset sequence; the JTAG TAP controller will not be active if the chip is not powered and reset correctly. Second, verify the boot mode pins (MIO[8:2]) are configured for JTAG boot mode, as an

Alan Carter
Senior Hardware Engineer & Component Specialist
Alan has over 15 years of expertise in embedded systems design, FPGA architecture, and global semiconductor supply chains. He specializes in component cross-referencing, lifecycle management, and helping OEMs navigate supply shortages.